Organizations that invest in team cohesion see measurable returns. According to Gallup’s State of the Global Workplace report, highly engaged teams deliver 23% higher profitability and 78% lower absenteeism than their disengaged counterparts. Meanwhile, research from MIT’s Human Dynamics Laboratory, published in the Harvard Business Review, found that communication patterns alone account for roughly 50% of the variation in team performance.
These numbers translate directly into dollars. For a 200-person company losing 15% of its workforce annually, even a modest 5% improvement in retention saves six figures in recruiting and onboarding costs. Team building case studies give HR directors and operations leaders the documented proof they need to defend these investments in quarterly budget reviews.
Yet most organizations still struggle to connect team activities to business outcomes. Event planners book a ropes course or a happy hour, employees attend politely, and nothing changes on Monday morning. There is no baseline measurement, no follow-up survey, no link between the activity and quarterly KPIs. Without that link, the next budget cycle treats team building as a discretionary line item rather than a performance investment.
What Team Building Case Studies Reveal About Workplace Performance
A team building case study does more than tell a story. It isolates specific variables (activity format, group size, frequency, facilitation style), measures outcomes (engagement scores, turnover rates, project velocity, conflict incidents), and attributes changes to the intervention rather than seasonal trends or unrelated policy shifts.
The strongest case studies share three characteristics:
- Baseline data collected before the event: pre-activity surveys on trust, communication satisfaction, and psychological safety
- Post-activity measurement at 30 and 90 days: not just the day-of smile sheet, but sustained behavior change
- Business metric correlation: tying engagement survey movement to productivity output, retention, or customer satisfaction scores
When HR professionals present team building case studies that follow this structure, approval rates for future programming climb. Finance teams respond to numbers, not anecdotes.
The Hard Part of Justifying Team Building ROI
Budget conversations around team building often stall for predictable reasons. Understanding these obstacles is the first step toward overcoming them.
No Standardized ROI Framework
Unlike sales training or software licenses, team building lacks a universally accepted ROI calculation. HR leaders frequently present qualitative feedback (“everyone had a great time”) instead of quantitative evidence. Without a consistent framework that ties activities to retention percentages or productivity indices, CFOs remain skeptical.
Perception as Entertainment Rather Than Development
Many executives view team building as a morale perk, not a strategic initiative. This perception gap means proposals compete for discretionary budget rather than L&D or operations funding. Case studies that document performance improvements reframe the conversation from “fun expense” to “performance investment.”
One-Off Events Without Follow-Through
A single afternoon activity rarely produces lasting change. Organizations that run isolated events and then measure nothing confirm the skeptic’s bias. The most effective programs build team building into a quarterly or biannual cadence with measurement baked into each cycle.
Choosing Activities That Don’t Match the Team’s Actual Gaps
A team that struggles with cross-departmental communication does not benefit from an activity designed to build trust within small groups. Mismatched programming wastes budget and produces underwhelming results, making the next budget request harder to justify.
Google’s Project Aristotle: The Case Study That Changed Team Science
Google’s internal research project, known as Project Aristotle, studied over 180 teams across the organization to determine what separates high-performing groups from average ones. The findings surprised even Google’s data scientists: team composition (individual talent, seniority, tenure) mattered far less than team dynamics.
The single strongest predictor of team effectiveness was psychological safety, the shared belief that team members will not be punished for speaking up, asking questions, or admitting mistakes. Teams with high psychological safety completed projects faster, generated more innovative solutions, and retained members at higher rates.
For HR professionals building a case for team building investment, Project Aristotle provides a powerful reference point. Activities that create psychological safety (low-stakes collaboration, shared laughter, structured vulnerability) produce measurable performance gains. Activities that reinforce hierarchy or create anxiety do the opposite.
Documented Outcomes: Productivity, Retention, and Conflict Reduction
Beyond Google, multiple organizations and research groups have published team building case studies with hard metrics. The patterns are consistent across industries:
Productivity Gains
Gallup’s ongoing workplace research reports a 14% productivity increase in highly engaged teams compared to disengaged ones. Organizations that implement structured team building as part of their engagement strategy consistently report project completion rates improving by 10% to 20% within two quarters of starting a regular program.
Retention Improvement
Replacing a single mid-level employee costs between 50% and 200% of their annual salary. Teams that participate in regular, well-facilitated team building activities show 25% to 30% lower voluntary turnover, according to aggregated data from workforce development consultancies. For a department of 50 people, that translates to retaining three to four additional employees per year.
Conflict Reduction
The CPP Global Human Capital Report found that U.S. employees spend an average of 2.8 hours per week dealing with workplace conflict. Team building programs that focus on communication and trust-building reduce conflict-related time loss by up to 40% in documented case studies, freeing roughly one hour per employee per week for productive work.
| Outcome Metric | Typical Improvement | Source/Benchmark | Business Impact |
|---|---|---|---|
| Team Productivity | 14% increase | Gallup Workplace Research | Faster project completion, higher output |
| Employee Retention | 25-30% lower turnover | Workforce development studies | $50K-$150K saved per retained employee |
| Conflict Resolution Time | 40% reduction | CPP Global Human Capital Report | ~1 hour/week recovered per employee |
| Employee Engagement Scores | 20-30% improvement | Post-program survey data | Higher profitability, lower absenteeism |
| Cross-Department Collaboration | 15-25% improvement | Internal communication audits | Reduced silos, faster decision-making |
Why Interactive Game Shows Outperform Traditional Team Building Formats
Not all team building formats produce equal results. Passive activities (lectures, personality assessments distributed via email, unstructured social hours) generate low engagement and minimal behavior change. The formats that produce the strongest documented outcomes share specific characteristics: active participation, time pressure, collaborative problem-solving, and genuine fun.
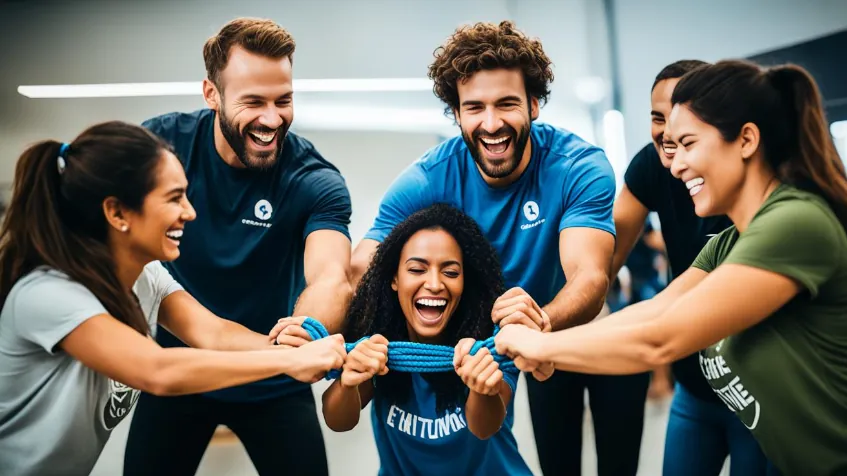
Interactive game show formats hit every one of these markers. They create natural collaboration under pressure, require real-time communication, and generate shared emotional experiences (laughter, friendly competition, collective wins) that build lasting social bonds. Research on experiential learning consistently shows that activities involving physical movement, decision-making under time constraints, and emotional engagement produce stronger memory formation and behavior transfer than passive alternatives.
Game show formats also solve a practical problem: participation equity. In a ropes course, the most athletic person dominates. In a trivia event, the most knowledgeable person carries the team. Well-designed game shows rotate the advantage across different skill sets (pop culture, strategy, physical challenges, creative thinking), ensuring every team member contributes meaningfully.
How It’s PlayTyme Game Shows Delivers Measurable Team Building Results
It’s PlayTyme Game Shows runs corporate team building events across New Jersey, New York City, and Connecticut that are specifically designed to produce the outcomes HR leaders need to document. Unlike generic event companies that offer team building as a side service, It’s PlayTyme specializes in high-energy, professionally hosted game show experiences built for groups of 20 to 300+ participants.
What separates their programming from a standard team outing:
- Structured collaboration mechanics: every game round requires cross-functional teamwork, not individual performance. Teams rotate roles so quiet contributors get spotlight moments alongside natural leaders.
- Scalable formats: programs work for a 25-person department retreat or a 400-person company-wide event. The facilitation adjusts to group size without losing engagement quality.
- Professional hosting: trained facilitators manage energy, pacing, and inclusion. This is not a DIY trivia night with a laptop and a projector. The production value creates an experience employees reference months later.
- Customizable content: game rounds incorporate company-specific themes, industry knowledge, and organizational values, connecting the fun directly to workplace identity.
Corporate clients consistently report improved team communication, stronger cross-department relationships, and higher post-event engagement survey scores. For organizations building a team building case study around their own programming, It’s PlayTyme provides the kind of memorable, high-participation experience that moves metrics.
Building Your Own Team Building Case Study: A Measurement Framework
Organizations that want to create internal case studies for ongoing budget justification need a simple, repeatable measurement process. This framework works regardless of the activity format:
Step 1: Establish Baseline Metrics (Two Weeks Before the Event)
Run a short pulse survey (5 to 8 questions) covering team trust, communication satisfaction, psychological safety, and collaboration quality. Use a consistent 1 to 10 scale. Record current retention rates, project completion timelines, and any available conflict or HR incident data.
Step 2: Capture Day-Of Data
Track participation rate, engagement observations (energy level, cross-group interaction, laughter frequency), and collect a brief post-event survey (net promoter score plus two open-ended questions). Photograph or video key moments for internal communications.
Step 3: Measure at 30 and 90 Days
Re-run the baseline pulse survey at 30 days and 90 days post-event. Compare scores across the same dimensions. Pull updated retention, project velocity, and conflict data for the same period. The 90-day mark separates temporary enthusiasm from sustained behavior change.
Step 4: Calculate and Present ROI
Quantify improvements in dollar terms: retention savings (employees retained multiplied by replacement cost), productivity gains (hours recovered multiplied by average hourly cost), and conflict reduction (hours saved multiplied by headcount). Present alongside the qualitative survey improvements for a complete picture.
How to Select the Right Team Building Program for Documented Results
Choosing a team building provider is not about finding the most entertaining option. It is about matching the activity format to your team’s specific gaps and your organization’s measurement goals. Ask these questions before booking:
- Does the format require genuine collaboration? Activities where individuals perform in parallel (bowling, escape rooms with one person solving puzzles) do not build team dynamics. Look for formats where success requires communication, shared decision-making, and role rotation.
- Is the provider experienced with your group size? A facilitator who excels with 15 people often struggles with 150. Ask for references at your specific scale.
- Does the activity create participation equity? The best programs rotate advantages across different strengths so every participant contributes, not just the loudest or most competitive.
- Will the provider support your measurement goals? Professional providers understand that HR needs data, not just happy photos. Ask whether they support pre/post surveys, provide participation metrics, or offer follow-up resources.
Organizations in the tri-state area looking for a provider that checks every box should explore It’s PlayTyme’s corporate event programs. Their game show format naturally produces high participation, cross-team collaboration, and the kind of shared experience that shows up in engagement surveys weeks later. Reach out to their team to discuss programming that fits your group size, goals, and measurement framework.
Frequently Asked Questions (FAQs)
How do you measure the ROI of team building?
Calculate ROI by quantifying retention savings (employees retained multiplied by their replacement cost), productivity gains (additional output or hours recovered), and conflict reduction (time saved on workplace disputes). Compare the total dollar value of these improvements against the cost of the program. Well-documented programs report returns of 5x to 10x the initial investment.
Does team building actually improve productivity?
Yes. Gallup research shows highly engaged teams deliver 14% higher productivity than disengaged teams. Structured team building programs that focus on communication, trust, and collaboration directly increase engagement, which drives measurable productivity improvements within one to two quarters.
What types of team building activities produce the best measurable outcomes?
Activities that require active participation, collaborative problem-solving, and time-pressured decision-making produce the strongest results. Interactive game shows, collaborative simulations, and structured challenge courses outperform passive formats like personality assessments or unstructured social events. The key factors are participation equity, genuine fun, and facilitation quality.